Probability, Classifiers, and Bayes Error
Bayes Rule and Classifiers
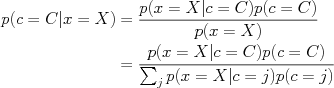
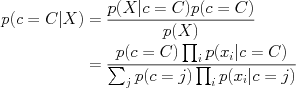
Bayes rule is used to compute the posterior probability of a variable, say a class c, having value C given that we have observed another variable x having value X.
 Here,
Here,  is the probability of our observations X under class C, and
  is the prior probability of seeing class C.
The Bayes-optimal strategy (i.e., the strategy with lowest probability of error) is then given by simply choosing to predict the value of C that has the largest posterior probability. To see this, note that we are trying to minimize the cost
 where C is the "true" value and
  is our prediction based on X.
To visualize this process, we can plot the probability density function associated with each class C separately, i.e.,  as a function of x. Since
  , this function will have the same shape as the class-conditional distribution
  , but will be scaled by the probability of class C. Given any decision rule, the total probability of error will be the total mass of these densities that lie in the "wrong" region. The figure shows three decision regions: one corresponding to low error rate within class c=0, one with low error rate in class c=1, and one (the Bayes optimal decision) with lowest total error. In each, the decision boundary is shown by a vertical black line, and for each class, the probability mass of data that will be classified incorrectly by that decision rule is shaded.
| Mini: PHP-GD image library not found. Exiting. | Mini: PHP-GD image library not found. Exiting. | Mini: PHP-GD image library not found. Exiting. | Mini: PHP-GD image library not found. Exiting. |
| for C=0,1 | Low class 0 error | Low class 1 error | Lowest total error |
- Choose the most likely class given the data
- Bayes Error rate
- Probability of error
- Variants: minimum risk for binary classifiers
Bayes classifiers and class-conditional distributions
MLE probability density estimation and classification
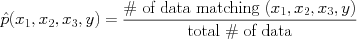
Our typical MLE estimate of a discrete joint probability is, for example,
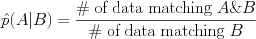
 For a conditional probability of some event (pattern of variables) A given another observed pattern B it is,
Overfitting in joint distribution estimates
- Number of parameters in the joint probability
- What happens when we observe zero counts of something?
Naive Bayes models
The Naive Bayes model assumes conditional independence among the features "x" given the class "c". This means that, in the Bayes rule equation before, we assume that
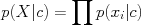 and we can learn each feature distribution
  individually. Plugging into Bayes rule we have
- Form and implications
- Estimating independent feature distributions
