
|
|
Projects /
GraphicalModelsGraphical ModelsGraphical models are used to encode structured relationships among collections of random variables. These relationships may be logical (for example, expressing forbidden combinations of values), but most often are probabilistic, expressing the relative likelihood of co-occurrence. These relationships are expressed as a graph in which directly related variables are connected, which can then be used to simplify and automate reasoning over the full system. Our work has focused on several aspects of graphical models, including
Belief PropagationLoopy belief propagation (Pearl 1988) is a popular algorithm for approximate inference. Its popularity stems in part from its extremely effective application to channel coding, first to turbo decoding and then to low-density parity check (LDPC) codes (McEliece et al. 1998). While initially not well understood, in recent years a host of theoretical results have been obtained which help to quantify its behavior. Belief propagation comes in two general flavors: sum-product, which attempts to estimate the marginal probabilities of outcomes, and max-product, which attempts to estimate the most likely configuration of the variables. Convergence and accuracy of sum-product Fig 1: Bethe and SAW trees We have developed several results on the behavior of the sum-product algorithm, including convergence conditions and bounds on the accuracy of the resulting marginal probabilities. Our techniques are based on analyzing the Bethe tree (or computation tree) of the BP algorithm, at right. The Bethe tree is formed by "unrolling" the graph G around a root node (say, "1"), so that the root of the Bethe tree corresponds to node "1", the next level corresponds to "1"'s neighbors, the next to their neighbors (not including their parent, "1"), and so on. (Figure 1, both black and red nodes.) If G is a tree, each node will appear only once, but if not each node may have many copies within the Bethe tree. BP at level L from the bottom of the Bethe tree corresponds to the Lth iteration of loopy BP. Intuitively, convergence then corresonds to mixing, or decoupling of the root distribution from the initial conditions at the leaves. If for any set of initial conditions, the belief at the root is the same, then BP must converge to a unique fixed point. Again intuitively, this is likely to happen if the correlations among variables is weak, and sufficiently weak that the dependence from level to level dies off fast enough to offset the increasing number of nodes at each level. We have developed several sufficient conditions that guarantee this, using mixing properties of the factors of G (NIPS 2004, JMLR 2005). Mooij & Kappen (2007) extended our analysis to factor graphs. The accuracy of the the beliefs can be assessed using a subtree, called the self-avoiding walk (SAW) tree (Fig 1, black nodes). In essence, it corresponds to the unrolling of the graph G, up to the point at which each path forms a loop. Self-avoiding is a slight misnomer, since the walks forming this graph do intersect themselves, but only at the terminal point. Marginal probability bounds can be computed by applying our convergence analysis to only this subtree. Reweighted sum-product variantsWe are also very interested in so-called reweighted variants of sum-product, which enable bounds on the normalization constant (called the partition function) of the distribution. These bounds can be used in learning, since for normalized models they correspond to the data likelihood, and can also be used to produce bounds on marginal probabilities. Our negative tree-reweighted BP work shows how tree-reweighted sum-product can be modified to produce a lower bound on the partition function (as opposed to an upper bound). The resulting algorithm generalizes the structured mean field approach. Reweighed max-product variantsReweighted approaches to optimization are a powerful tool for combinatorial search. These methods are closely related to linear programming relaxations, and provide both upper and lower bounds on the optimal configuration.
Our work has developed efficient data structures to optimize and solve the resulting bounds, such as the covering tree (Yarkony et al. 2010).
Adaptive Inference Fig. 2: Hierarchical clustering Adaptive inference describes the problem of repeatedly modifying and performing inference on a model. Since the sequence of models to be used are very similar to one another (i.e., only incremental changes are made at each stage), the results of previous inferential calculations can be used to compute the new results much faster than if performed from scratch. We use a tree contraction process to define a hierarchical clustering of the nodes in the factor graph (Fig. 2). This clustering then implies a (partial) elimination ordering on the variables in the graph. The contraction process guarantees that for any change to the model, only O(log n) computations must be recomputed. Our data structure can be used to incorporate arbitrary changes, including model structure or observations, in O(log n) time. New marginal probabilities can be computed (queried) in O(log n) time. Moreover, without knowing their number or position a priori, we can find all changes to the optimizing configuration in O(k log n) time, where k is the number of variables whose optimal configuration has changed.
Continuous random variables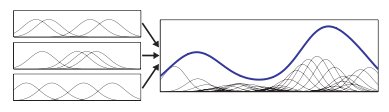 Fig 3: NBP uses Gaussian mixtures to represent beliefs Graphical models for discrete valued random variables are fairly well-studied, but continuous (and non-Gaussian) random variables are much more complex, despite the fact that many real-world problems consist precisely of such systems. We have developed several algorithms for dealing with continuous-valued distributions, including nonparametric belief propagation (which represents beliefs using Gaussian mixture distributions) and particle belief propagation (which uses importance-weighted samples).
Learning graphical modelsOne of the most important tasks in probabilistic models is their construction based on collections of data (statistical learning). We are interested in estimating both the structure of the model, and in its parameters given a fixed structure. Recent emphases include using composite likelihood to improve the accuracy of the model while preserving efficiency, and exploring sequential Monte Carlo approaches to learning. |